
Making a Difference

Mapping Climate Risk From Afghan Districts To Practical Action
Afghanistan’s climate risks are local in ways that national statistics can conceal. A dry year may threaten livestock in one district, destroy rain-fed crops in another and reduce drinking water in a third. Flooding can isolate a valley, damage a market road or contaminate wells within hours. For communities already affected by conflict, displacement and poverty, the location of risk often determines whether a shock becomes a short-term setback or a humanitarian emergency.
A district-level approach to climate adaptation brings those differences into view. It combines climate science, satellite imagery, hazard records and local knowledge to identify which places and people face the greatest exposure. The resulting maps can guide drought planning, flood protection, water investment, agricultural support and emergency preparedness through a common evidence base.
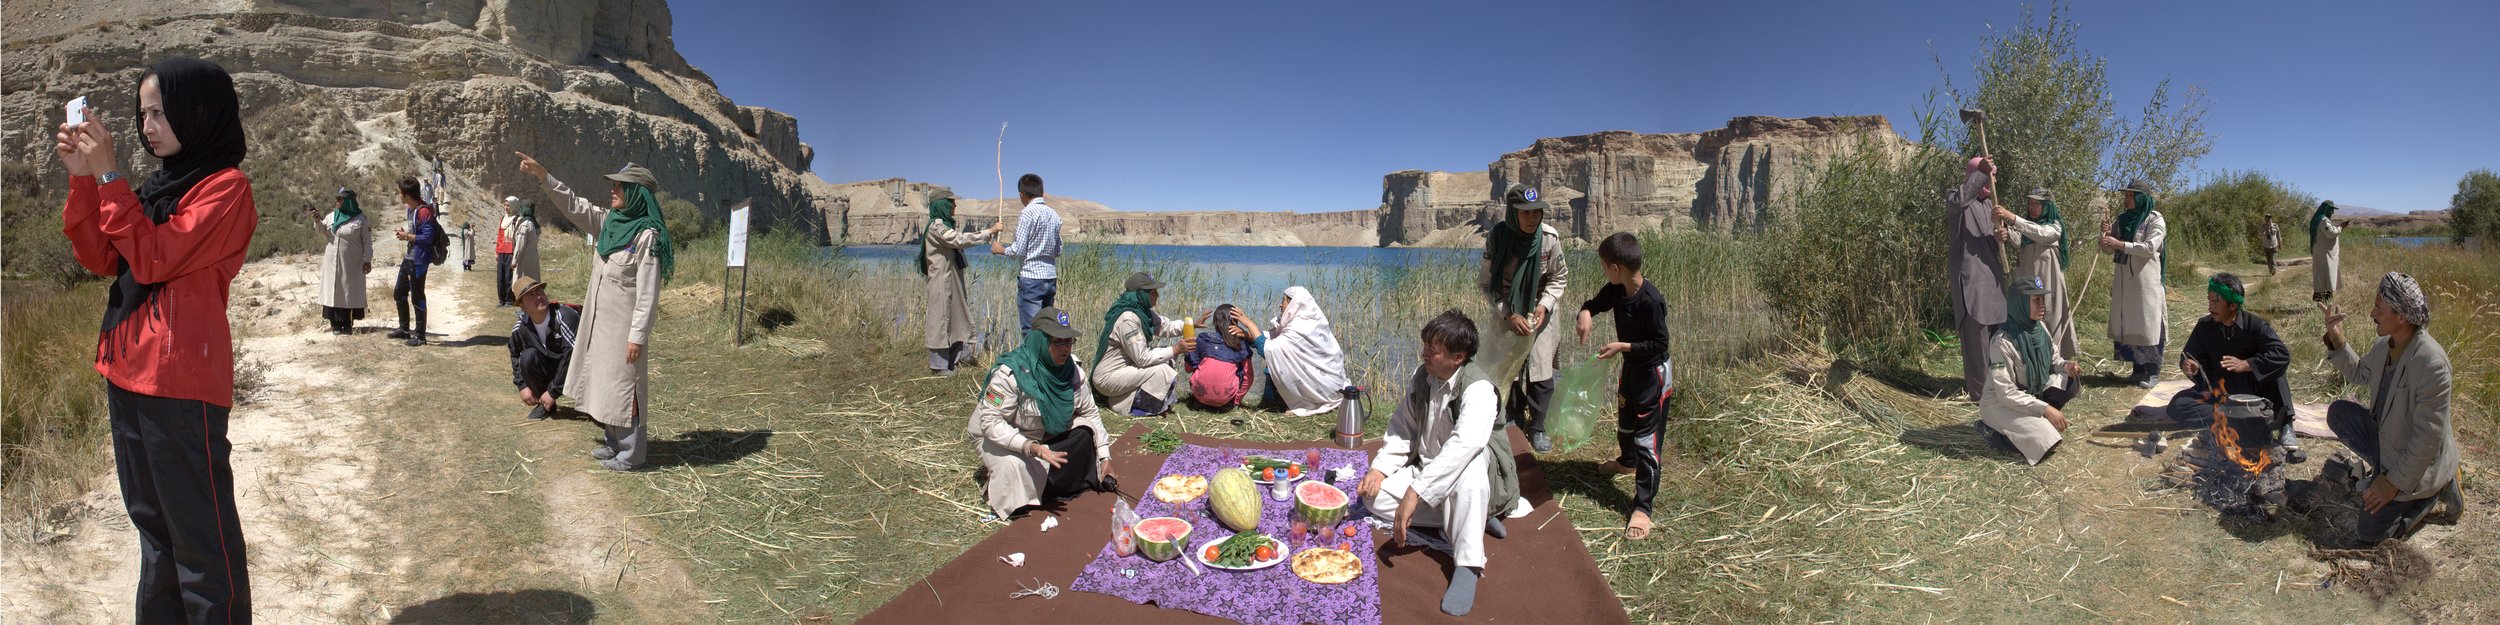
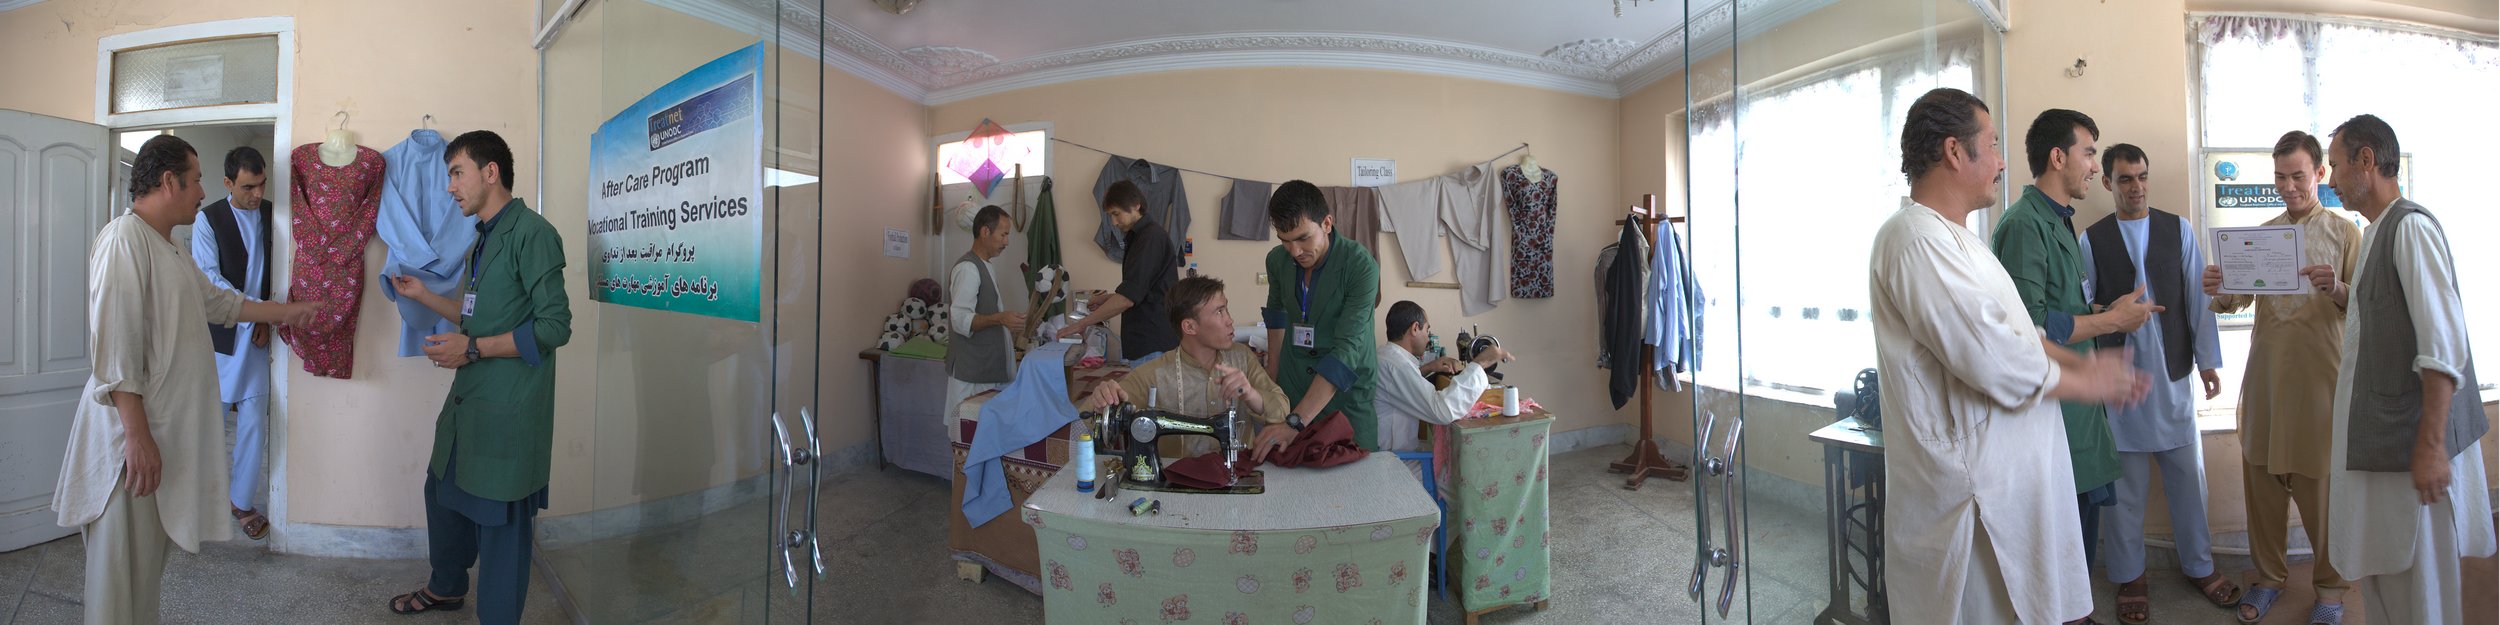
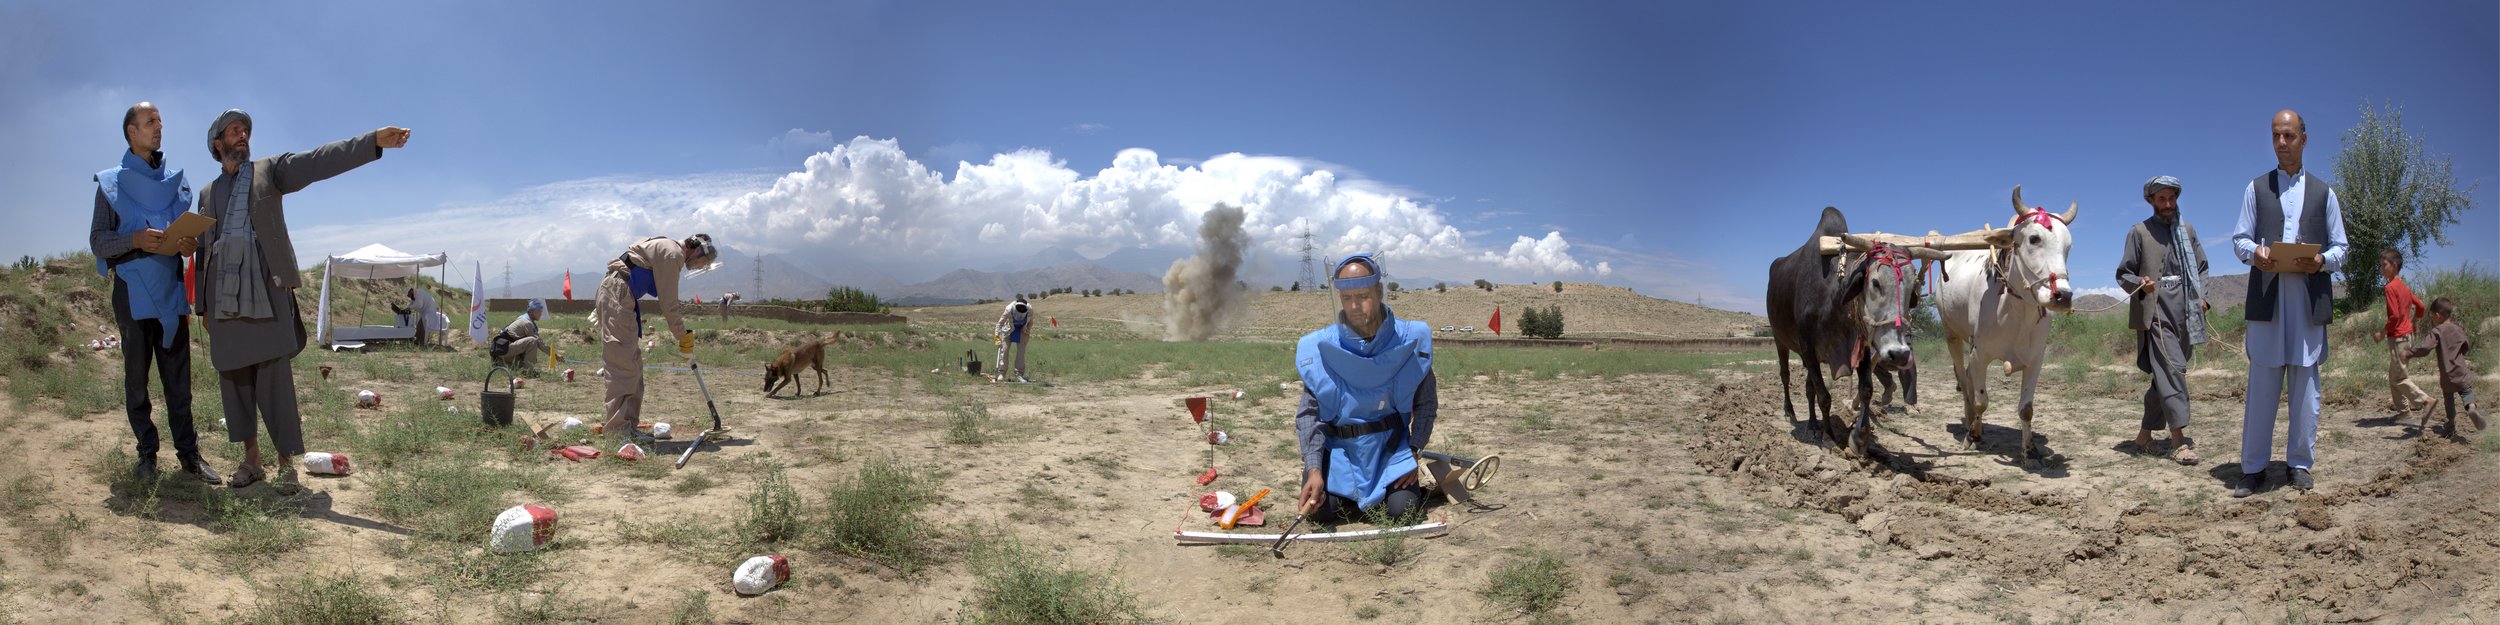
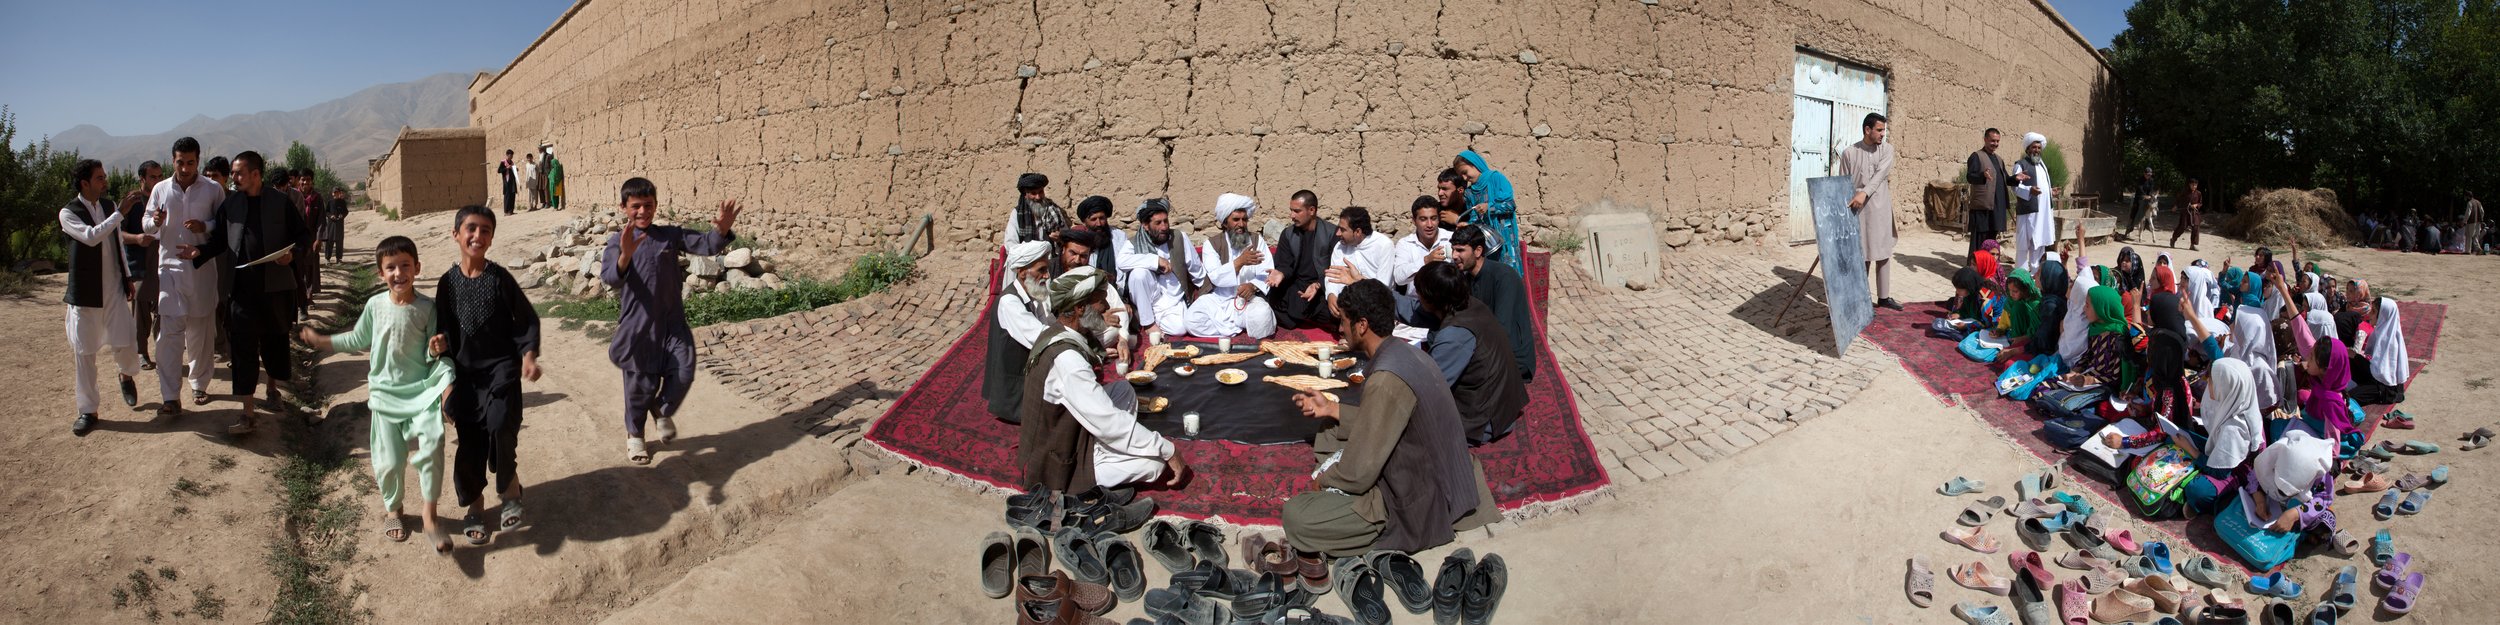
The work fits the United Nations’ broader role in Afghanistan: supporting national institutions, coordinating international assistance and working with communities. The archived “Strong UN. Strong Afghanistan.” campaign highlighted Afghan people and their contributions. Climate adaptation extends that principle by placing Afghan experience at the centre of decisions about where risks occur, which responses are practical and how resources should be prioritised.
Why District-Level Mapping Matters
Afghanistan’s geography creates sharp contrasts over relatively short distances. The Hindu Kush, high mountain valleys, northern plains and southern desert areas experience different rainfall patterns, temperatures and water conditions. A province-wide average may be useful for planning, yet it can hide the difference between a flood-prone river corridor and a remote settlement dependent on a seasonal spring.
District mapping makes the scale of decision-making more practical. District administrations, humanitarian teams, farmers’ groups and health services often organise their activities around places smaller than a province. A map that identifies exposed villages, roads, irrigation channels, schools and health facilities can help them prepare for a specific hazard rather than respond to an abstract national trend.
It also improves the targeting of scarce funds. Adaptation budgets cannot reinforce every embankment, rehabilitate every canal or provide water storage in every settlement at the same time. Risk maps support transparent choices by showing where hazard, exposure and vulnerability overlap. That is particularly important where communities have limited access to markets, public services and reliable transport.
Building A Climate Risk Picture
A useful risk map brings together three elements. Hazard refers to the climate event itself, such as drought, flash flooding, extreme heat, heavy snowfall or a changing pattern of rainfall. Exposure describes what lies in harm’s way, including homes, farmland, livestock, roads, bridges, power systems, schools and clinics. Vulnerability reflects how severely people or assets may be affected and how much capacity they have to recover.
The evidence can come from several sources. Historical rainfall and temperature observations help establish trends and seasonal variability. Satellite data can reveal changes in vegetation, snow cover, surface water and land use. Hydrological information can identify catchments and flood routes, while agricultural data shows where rain-fed farming, irrigation and grazing are concentrated. Records of past disasters add a human and economic dimension to the analysis.
Local knowledge is essential for interpreting these layers. Residents may know that a stream changes course after a particular type of storm, that a pasture becomes inaccessible before official drought indicators appear or that a road is routinely cut off by snow. Consultation can also reveal risks absent from formal datasets, such as the extra burden on women collecting water or the danger faced by people living in informal settlements.
The quality of the map depends on the quality of its data. Afghanistan has gaps in weather stations, population records, land-use information and infrastructure inventories. Mapping should therefore show uncertainty rather than present every boundary as exact. A transparent record of sources, dates and limitations helps planners use the information responsibly.
Drought, Water Stress And Food Security
Drought is one of Afghanistan’s most persistent climate threats. It reduces crop yields, weakens pasture, lowers groundwater recharge and places pressure on already limited drinking-water supplies. District-level analysis can distinguish between agricultural drought, which affects soil moisture and crops, and hydrological drought, which affects rivers, springs, reservoirs and groundwater over a longer period.
This distinction matters for adaptation. A district experiencing repeated crop failure may need drought-tolerant seed, improved extension services, small-scale water harvesting and support for alternative livelihoods. A district with declining groundwater may require well monitoring, better irrigation efficiency and agreements on water use. A pastoral area may need livestock health services, grazing management and early support before animals are sold at distressed prices.
Food security planning can use the same maps. Districts with high dependence on rain-fed agriculture, poor road access and few functioning markets may be especially vulnerable when harvests fail. Mapping can help humanitarian partners pre-position supplies, identify households needing cash or food assistance and link emergency measures with longer-term agricultural recovery.
There is a relevant lesson for Australia. The Bureau of Meteorology’s drought information, agricultural outlooks and water data are most useful when translated into decisions for particular catchments and communities. In the Murray–Darling Basin, water allocation and farm planning depend on local conditions rather than a single national rainfall figure. An Afghan district map serves a comparable purpose in a very different institutional and economic setting.
Floods, Heat And Essential Services
Flood risk is often concentrated along rivers, wadis and steep mountain channels, but damage can spread rapidly when bridges, roads and irrigation systems fail. Satellite-based flood footprints and elevation models can show where water is likely to move. Combined with settlement and infrastructure data, they can identify evacuation routes, safe locations, vulnerable crossings and facilities that need protection.
Flash floods deserve particular attention because warning time may be short. A district adaptation plan can connect rainfall monitoring with community alert systems, local radio, mobile messaging and clear instructions for schools, transport operators and village leaders. It can also support simple measures such as clearing drainage channels, protecting wells from contamination and storing essential medicines above expected flood levels.
Rising temperatures create a different pattern of risk. Extreme heat can affect outdoor workers, children, older people and those living in poorly ventilated homes. It can increase water demand, reduce labour productivity and place pressure on health facilities. District health plans can use heat-risk mapping to identify communities needing cooling spaces, public information, drinking water points and outreach during severe weather.
Australian communities recognise the value of place-based heat and disaster planning. Melbourne’s urban heat concerns differ from those of remote communities in the Northern Territory, while bushfire planning around Canberra or Adelaide must account for vegetation, wind and settlement patterns. Afghan mapping requires its own methods, yet the principle is familiar: emergency plans work best when they reflect the hazards, infrastructure and social networks of a specific area.
Turning Maps Into Adaptation Decisions
Maps have value only when they influence action. A district risk profile should therefore connect each major hazard with feasible measures, responsible institutions, likely costs and indicators of progress. For drought, this might mean water-point rehabilitation, watershed restoration, improved seed distribution and livelihood diversification. For flooding, it may mean bridge upgrades, floodplain management, drainage works and community warning arrangements.
The process should work across humanitarian, development and peacebuilding efforts. Emergency teams may focus on immediate protection, while development partners invest in water systems, roads and agricultural resilience. If these activities use different risk assumptions, resources can be duplicated or directed towards projects that increase exposure. A shared district evidence base gives partners a common starting point.
Social inclusion needs to be built into the analysis. Women, children, people with disabilities, older people, displaced families and minority communities may face different risks within the same village. They may also have less influence over land, water or recovery decisions. Consultation should be designed so that these experiences affect project selection, rather than treating participation as a symbolic step.
Adaptation also needs safeguards. A new water point can reduce pressure on one settlement while creating disputes elsewhere if groundwater access is not considered. A flood embankment may protect farmland but divert water towards homes. District planning should assess downstream effects, land rights, maintenance responsibilities and access for people who are often excluded from formal services.
Coordination, Financing And Accountability
The United Nations can help connect information held by different agencies and partners. Humanitarian organisations may maintain displacement and needs data, development programmes may hold infrastructure inventories, government departments may manage agricultural or water records, and local communities may possess detailed environmental knowledge. Coordination can reduce duplication and make climate risk information easier to use.
Financing should follow risk and vulnerability, not simply population size or the visibility of a disaster. A remote district with a small population may require a costly bridge or water system to maintain access to health care and markets. A densely settled district may benefit from lower-cost measures delivered at scale. Public criteria for prioritisation can strengthen trust and make funding decisions easier to review.
Monitoring should measure whether adaptation is reducing harm. Useful indicators might include the reliability of water points, the number of households receiving credible early warnings, travel time to health services after floods, crop losses during dry seasons or the survival of restored rangeland. Community feedback should be recorded alongside technical measurements, since a project can meet an engineering target while failing to serve the people it was designed to support.
There are practical parallels with the Australian market. Councils, insurers, farmers, utilities and emergency services increasingly use hazard information to make investment decisions, though affordability and data access remain concerns. In Afghanistan, where institutional capacity and household resources are more constrained, open standards and shared mapping tools can help partners avoid creating separate, incompatible systems.
From Risk Maps To Community Resilience
District-level risk mapping should be treated as a living process rather than a finished atlas. Climate conditions change, settlements move, infrastructure deteriorates and new data becomes available. Maps need regular updating after major floods, droughts, population movements and construction projects. Local review can identify errors that are invisible in remote analysis.
The most useful outputs may be simple. A community map can show safe routes, water points, flood channels and locations requiring assistance. A district dashboard can track rainfall, water availability, crop conditions and access to services. Printed maps remain important where electricity, internet connections and smartphones are unreliable. The format should match how people receive and act on information.
Afghan institutions and communities should retain ownership of the knowledge produced. Data protection matters where maps could expose the locations of vulnerable families, displaced people or critical infrastructure. Access arrangements should distinguish between information suitable for public awareness and sensitive data that requires safeguards.
Climate adaptation is ultimately about choices made before disaster strikes. A well-designed map can help identify those choices, but it cannot replace local leadership, sustained financing or accountable institutions. The United Nations’ role is strongest when it supports Afghan expertise, strengthens coordination and helps convert evidence into services that people can see in their daily lives.
For readers in Australia, the comparison is a reminder that climate resilience begins with useful local information. Whether the setting is a farming district near the Murray, a flood-affected suburb in Brisbane or an Afghan valley dependent on seasonal water, broad climate trends become meaningful when they guide a specific decision.
Support efforts that make climate risk information accessible, locally verified and connected to practical investment. Follow UN Afghanistan’s official information channels and trusted humanitarian reporting for updates on climate resilience, community priorities and the partnerships helping Afghan districts prepare for a more uncertain climate.